
Categories
Market UpdatesPublished October 23, 2026
Pittsburgh Home Affordability in 2026: How Allegheny County Compares

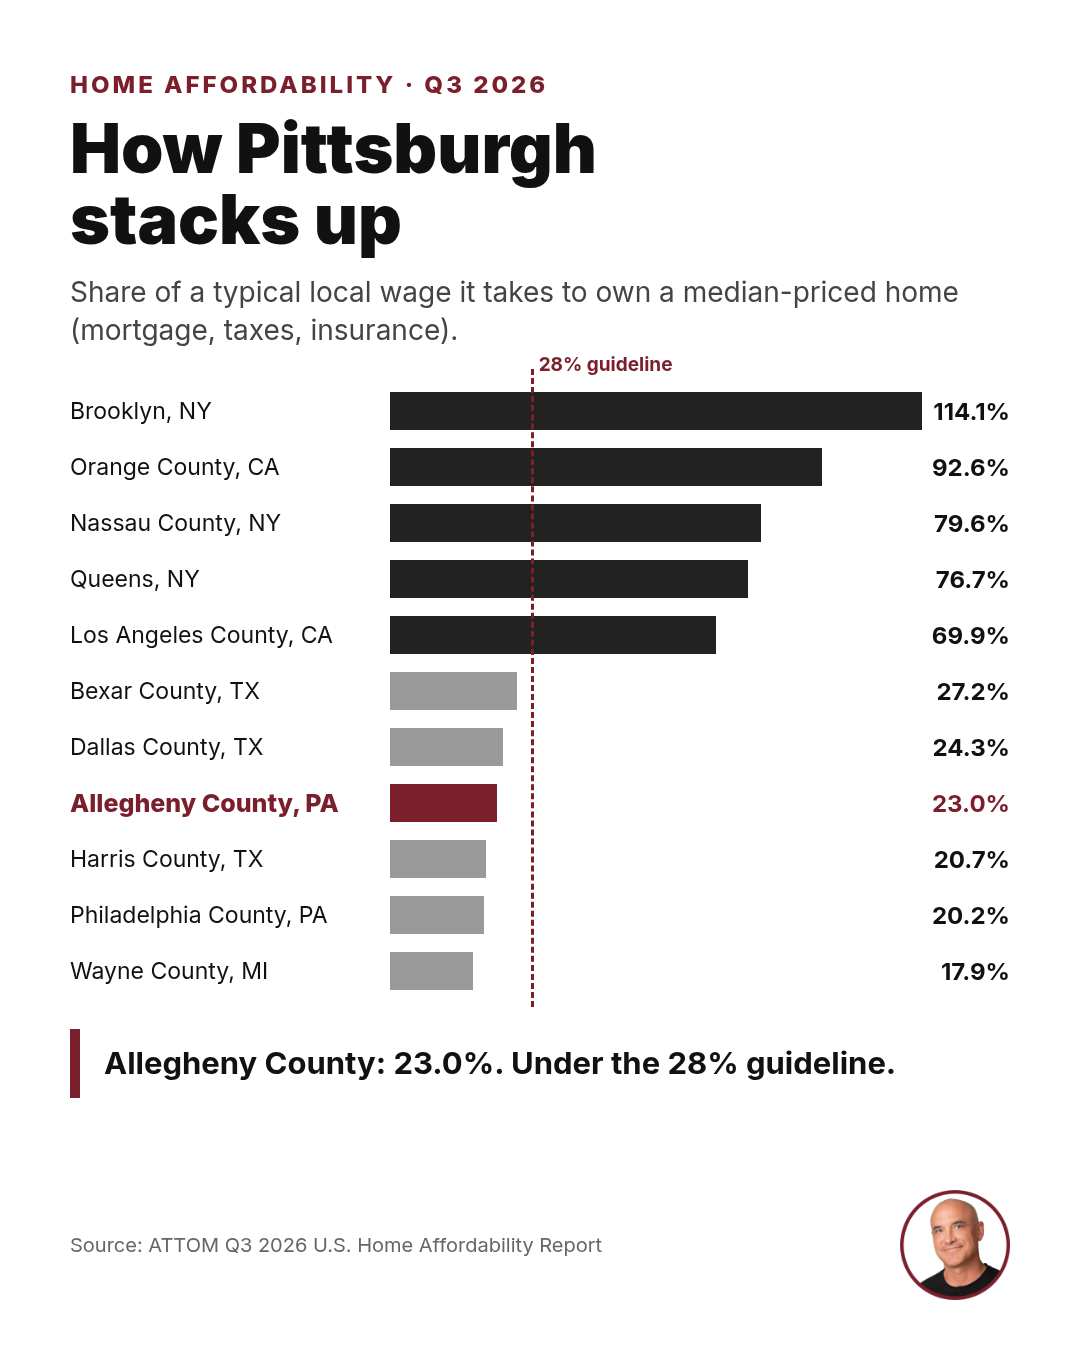
Short answer: In the third quarter of 2026, the costs to own a median-priced home in Allegheny County took about 23.0% of a typical local wage. That is under the 28% guideline. In Brooklyn, it took 114.1%.
What this number means
ATTOM looks at the main monthly costs to own a median-priced home:
- Mortgage payment
- Mortgage insurance
- Property taxes
- Homeowner's insurance
It then compares those costs to the typical wage in each county. The math assumes 20% down and a 30-year fixed loan. A common rule says these costs should be 28% of pay or less.
How Allegheny County stacks up
Share of a typical local wage needed to own a median-priced home, Q3 2026:
- Brooklyn (Kings County), NY: 114.1%
- Orange County, CA: 92.6%
- Nassau County, NY: 79.6%
- Queens County, NY: 76.7%
- Los Angeles County, CA: 69.9%
- Bexar County, TX: 27.2%
- Dallas County, TX: 24.3%
- Allegheny County, PA: 23.0%
- Harris County, TX: 20.7%
- Philadelphia County, PA: 20.2%
- Wayne County, MI: 17.9%
The whole US was at 31.8%, which is over the guideline.
Allegheny County by the numbers
- Median home price: $255,000
- Typical yearly wage: $81,952
- Yearly income needed to afford the median home: $67,285
- Median price change from a year ago: up about 7.6%
- Wage change from a year ago: up about 3.8%
So a typical wage in Allegheny County is more than the income needed to own the typical home. That is not true in most of the country. ATTOM found that in 467 of 583 counties, the costs were more than the typical resident's wages could cover under the 28% rule.
Other Pittsburgh-area counties
ATTOM's county data also lists nearby counties:
- Washington County: about 23%
- Beaver County: 24.6%
- Westmoreland County: 26.5%
- Butler County: 35.5%
Washington, Beaver and Westmoreland Counties are under the 28% guideline. Butler County is over it. Butler had the highest median price of the group, at $350,000.
Why it still feels hard for some buyers
Under the guideline does not mean easy. ATTOM says that in 98% of counties, homes were less affordable than their own past normal. Mortgage rates are a big reason. ATTOM listed the 30-year fixed rate at 7.3% at the end of the quarter.
Your own number depends on your pay, your debts, your down payment and the home you pick. A typical wage is not every wage.
For a look at how prices and sales are moving, see our September 2026 Pittsburgh market report and Pittsburgh Housing Market: Flattening, Not Falling. Thinking about buying here? Read the pros and cons of buying a home in Pittsburgh.
Common questions
Is Pittsburgh affordable for homebuyers in 2026?
By ATTOM's measure, yes, compared with most of the US. In Q3 2026, owning a median-priced home in Allegheny County took about 23.0% of a typical local wage, under the 28% guideline.
What is the 28% guideline?
It is a common rule that your main housing costs (mortgage, taxes and insurance) should be 28% of your pay or less.
How much income do you need to buy a median-priced home in Allegheny County?
ATTOM estimated about $67,285 a year for a $255,000 median-priced home in Q3 2026, with 20% down.
How does Allegheny County compare to Philadelphia?
Philadelphia County was a bit lower at 20.2%. Both were under the 28% guideline.
Are the counties around Pittsburgh affordable too?
Washington (about 23%), Beaver (24.6%) and Westmoreland (26.5%) Counties were under 28%. Butler County was over, at 35.5%.
For illustration only. Not a loan offer or commitment to lend. Rates, payments, and terms depend on credit, income, loan program, and lender approval, and can change without notice. Buyers may need to qualify at the full note rate. Talk to a licensed lender for details.
Sources
- ATTOM, Q3 2026 U.S. Home Affordability Report, Oct 22, 2026, including its county data table: https://www.attomdata.com/news/market-trends/home-sales-prices/q3-2026-home-affordability-index/
Matt Durbin | eXp Realty
(412) 998-8896 | Broker: (888) 397-7352
MAD.Homes

Matt Durbin
Team Leader | Matt Durbin Team | eXp Realty
or another way